What Is T Test With Proportions? Easy Stats Solution

When dealing with statistical analysis, particularly in the context of comparing groups or assessing the significance of differences, the t-test is a fundamental tool. However, the t-test primarily applies to comparing means. But what if we’re interested in comparing proportions instead of means? That’s where the concept of a t-test with proportions comes into play, although technically, when dealing with proportions, we’re often discussing a related but distinct statistical approach.
Understanding the Basics
T-Test: Traditionally, a t-test is used to determine if there are any statistically significant differences between the means of two groups. It’s a parametric test, meaning it assumes the data follows a normal distribution and requires the data to be measured on an interval or ratio scale.
Proportions: When we’re dealing with proportions, we’re typically looking at categorical data (e.g., success/failure, yes/no) and want to compare the proportion of one category between two or more groups. This doesn’t directly fit the traditional t-test scenario.
T-Test with Proportions: Conceptual Approach
While the traditional t-test isn’t directly applied to proportions, there is a way to approach the comparison of proportions using a similar logic. When comparing proportions, what we’re essentially looking at is the difference in the probability of an event occurring between two groups. For instance, if we’re comparing the proportion of people who prefer a certain brand of coffee between two different regions, we’re looking at the proportion of “yes” responses in each region.
Statistical Approach to Comparing Proportions
The appropriate statistical test for comparing proportions is often the Z-test for proportions or the Chi-Square test, depending on the study design and the nature of the data.
Z-Test for Proportions: This test is used when comparing the proportions of two independent groups to see if there is a significant difference between them. It calculates the standard error of the difference between proportions and then uses this to calculate a Z-score, which can be looked up in a standard normal distribution table to find the p-value.
Chi-Square Test: This is a more versatile test that can compare proportions across more than two groups and can handle multiple categories. It’s commonly used for categorical data and assesses how likely it is that any observed difference between the variables and the expected outcome could have occurred by chance.
Applying the Concept to Real-World Scenarios
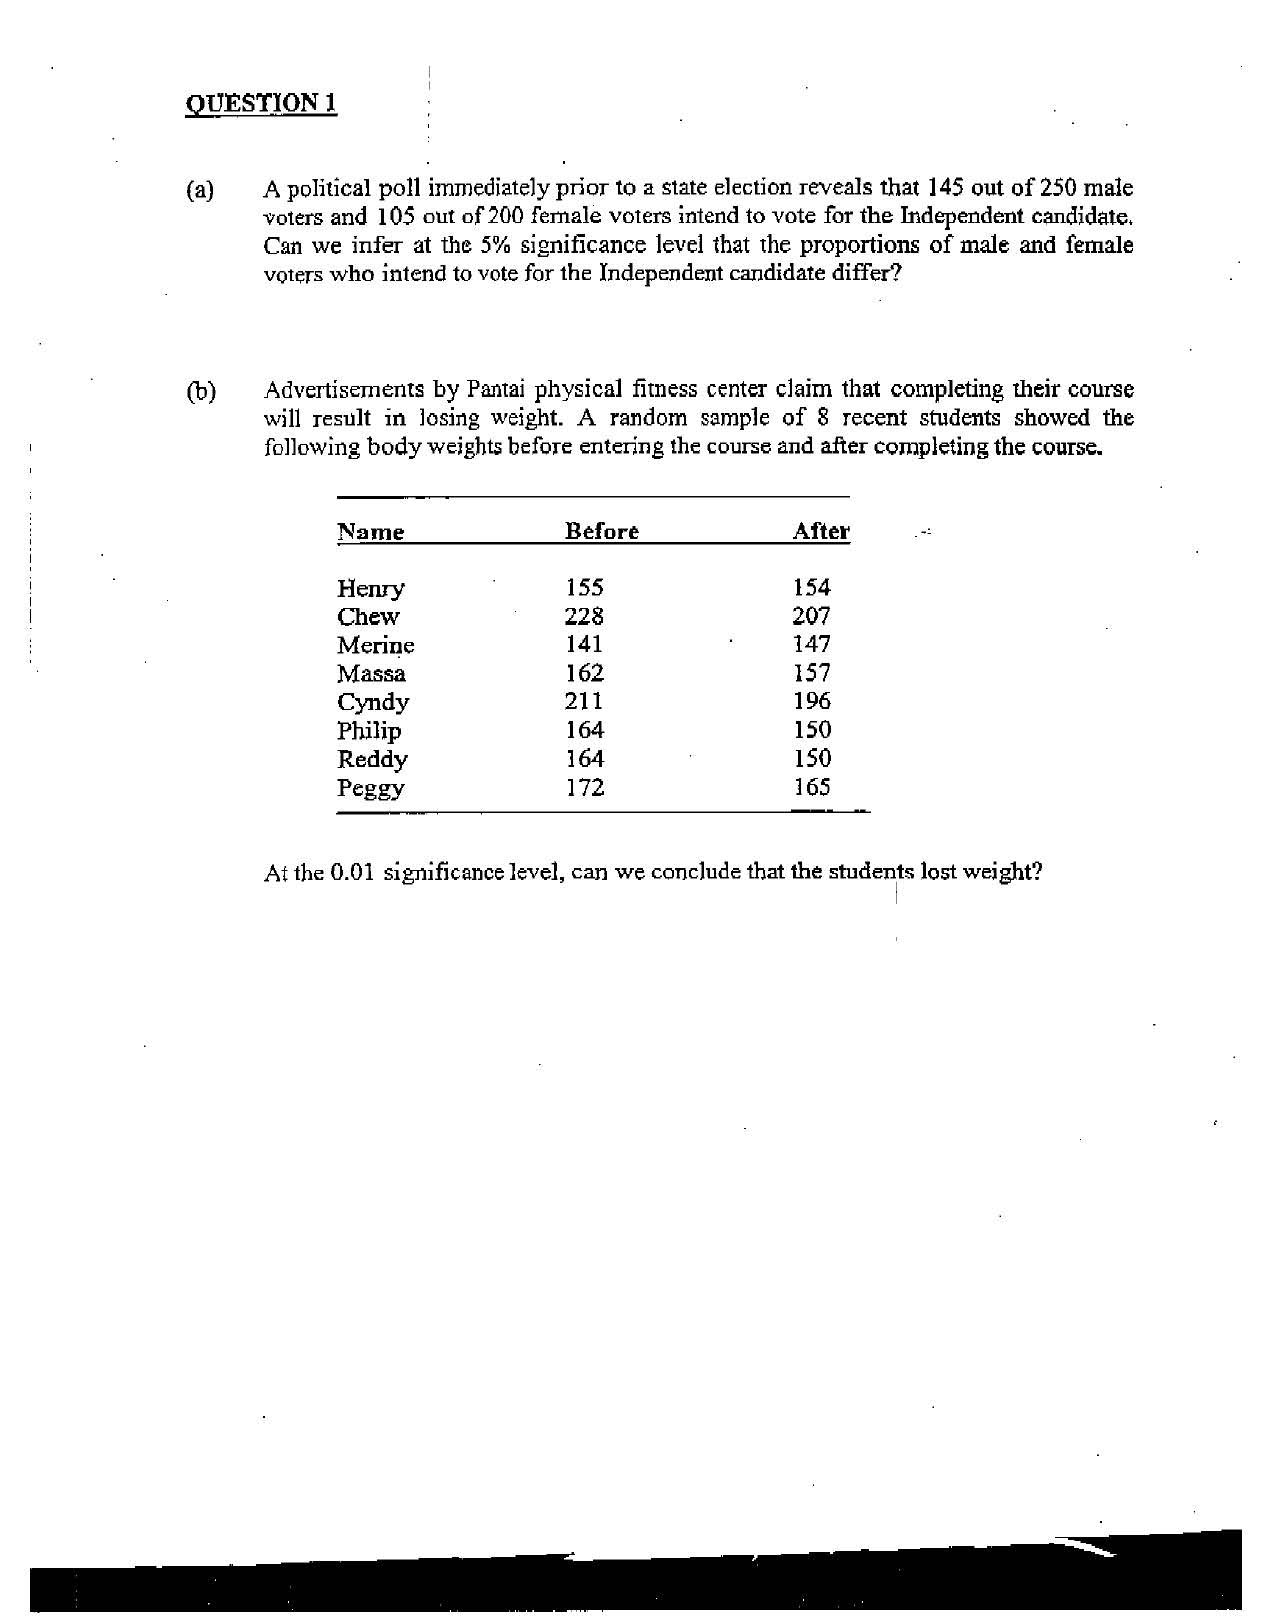
Imagine a marketing firm wants to know if there’s a significant difference in the proportion of customers who prefer their new product packaging between the eastern and western regions of the country. They collect a random sample of 100 customers from each region and ask for their preference.
Let’s say the results are as follows: - Eastern Region: 60 out of 100 customers prefer the new packaging. - Western Region: 45 out of 100 customers prefer the new packaging.
To determine if the difference in proportions (60% vs. 45%) is statistically significant, the marketing firm could use a Z-test for proportions. If the p-value calculated from the test is below the chosen significance level (commonly 0.05), the firm could conclude that the difference in preferences between the two regions is statistically significant.
Conclusion
While the term “t-test with proportions” might not directly align with traditional statistical terminology, the concept of comparing proportions between groups is vital in many fields, including business, healthcare, and social sciences. By using the appropriate statistical tests, such as the Z-test for proportions or the Chi-Square test, professionals can make informed decisions based on data analysis. Understanding the nuances of statistical tests and when to apply them is crucial for meaningful insights and accurate conclusions.
FAQ Section
What is the main difference between a t-test and a test for comparing proportions?
+The main difference lies in what each test compares: the t-test compares means of continuous data, while tests for proportions (like the Z-test or Chi-Square test) compare proportions or percentages of categorical data.
When should I use a Z-test for proportions instead of a Chi-Square test?
+Use a Z-test for proportions when comparing the proportions of two independent groups. Use a Chi-Square test for comparing proportions across more than two groups or when dealing with multiple categories.
Can I use a t-test to compare proportions?
+No, a t-test is not appropriate for comparing proportions. It's used for comparing means of continuous data, not proportions of categorical data.
In conclusion, when dealing with the comparison of proportions, it’s crucial to select the appropriate statistical test based on the nature of the data and the research question. This ensures that the analysis provides meaningful and accurate insights, which is vital for decision-making in various fields.


