How To Graph Exponents? Stepbystep Solutions

Graphing exponents is a fundamental concept in algebra and is used to visualize the behavior of exponential functions. An exponential function is a function of the form f(x) = a^x, where a is a positive constant. Here’s a step-by-step guide on how to graph exponents:
Understanding Exponential Functions
Before diving into graphing, it’s essential to understand the basic properties of exponential functions. The function f(x) = a^x has the following characteristics:
- Domain: The domain of an exponential function is all real numbers.
- Range: The range is all positive real numbers if a > 0.
- Increasing/Decreasing: If a > 1, the function is increasing. If 0 < a < 1, the function is decreasing.
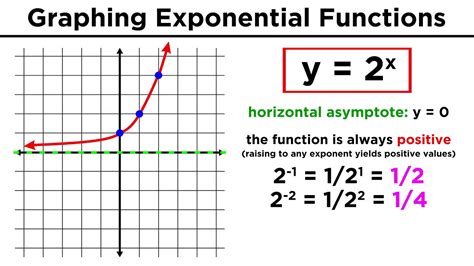
- Horizontal Asymptote: The line y = 0 (the x-axis) is a horizontal asymptote.
Step-by-Step Graphing
Identify the Base: Determine the base a of the exponential function. This will help you understand the behavior of the function.
Determine the Direction:
- If a > 1, the graph will rise from left to right.
- If 0 < a < 1, the graph will fall from left to right.
Find Key Points:
- y-intercept: When x = 0, y = a^0 = 1. So, the y-intercept is (0, 1) regardless of the value of a.
- x-intercept: For a > 1, there is no x-intercept because the function approaches the x-axis but never touches it.
- Other Points: Choose several other x values (both positive and negative) to calculate corresponding y values. The farther you go from x = 0, the more pronounced the effect of a will be.
Plot Points and Sketch the Curve:
- Plot the points you’ve calculated, including the y-intercept.
- Sketch a smooth curve that passes through these points. Remember, the curve should be continuous and should not intersect the x-axis (except for the point where x approaches infinity or negative infinity).
Label Axes and Add Title: Label the x and y axes, and give your graph a title that includes the equation of the function you’re graphing.
Example
Let’s say we want to graph f(x) = 2^x.
- Base: The base a = 2.
- Direction: Since a > 1, the graph will rise from left to right.
- y-intercept: At x = 0, y = 2^0 = 1.
- Other Points:
- For x = 1, y = 2^1 = 2.
- For x = 2, y = 2^2 = 4.
- For x = -1, y = 2^{-1} = \frac{1}{2}.
- For x = -2, y = 2^{-2} = \frac{1}{4}.
- Plot and Sketch: Plot these points, including (0,1), (1,2), (2,4), (-1, 1⁄2), and (-2, 1⁄4), and sketch a smooth curve through them.
Using Technology
While understanding how to graph exponents manually is important, technology such as graphing calculators and computer software (like Desmos or Mathematica) can be incredibly useful for quickly visualizing these functions and exploring their properties.
Conclusion
Graphing exponents involves understanding the properties of exponential functions and carefully plotting key points to visualize their behavior. By following these steps and practicing with different bases, you’ll become proficient in graphing exponential functions and better understand their applications in mathematics and real-world scenarios.
FAQs
What is the general form of an exponential function?
+The general form of an exponential function is f(x) = a^x, where a is a positive constant not equal to 1.
How do you determine the direction of an exponential function’s graph?
+If a > 1, the graph rises from left to right. If 0 < a < 1, the graph falls from left to right.
What is the y-intercept of any exponential function f(x) = a^x?
+The y-intercept is (0, 1) because a^0 = 1 for any positive a.

